-
728x90
chartJS는 html 웹 문서를 작성하면서 차트를 만들어 넣고 싶을 때 사용되는 스크립트 중 하나로 chartJS를 사용하기 사전 설치 작업이 필요하다. 설치하는 방법으론 여러방법이 있지만 가장 쉽고 편한 방법인 CDN 코드를 넣는 방법을 선택하여 설치를 해본다.
https://cdnjs.com/libraries/Chart.js
Chart.js - Libraries - cdnjs - The #1 free and open source CDN built to make life easier for developers
Simple HTML5 charts using the canvas element. - Simple. Fast. Reliable. Content delivery at its finest. cdnjs is a free and open-source CDN service trusted by over 12.5% of all websites, serving over 200 billion requests each month, powered by Cloudflare.
cdnjs.com
위 링크를 들어가서 맨 위에있는 코드를 복사해온다. 현재 작성자의 최신 버전은 아래와 같다.

<script src="https://cdnjs.cloudflare.com/ajax/libs/Chart.js/3.9.1/chart.min.js" integrity="sha512-ElRFoEQdI5Ht6kZvyzXhYG9NqjtkmlkfYk0wr6wHxU9JEHakS7UJZNeml5ALk+8IKlU6jDgMabC3vkumRokgJA==" crossorigin="anonymous" referrerpolicy="no-referrer"></script>
이제 코드를 작성해보자
<!DOCTYPE html>
<html lang="en">
<head>
    <meta charset="UTF-8">
    <meta http-equiv="X-UA-Compatible" content="IE=edge">
    <meta name="viewport" content="width=device-width, initial-scale=1.0">
    <title>chartjs</title>
    <script src="https://code.jquery.com/jquery-3.6.0.min.js" integrity="sha256-/xUj+3OJU5yExlq6GSYGSHk7tPXikynS7ogEvDej/m4=" crossorigin="anonymous"></script>
    <script src="https://cdnjs.cloudflare.com/ajax/libs/Chart.js/3.9.1/chart.min.js" integrity="sha512-ElRFoEQdI5Ht6kZvyzXhYG9NqjtkmlkfYk0wr6wHxU9JEHakS7UJZNeml5ALk+8IKlU6jDgMabC3vkumRokgJA==" crossorigin="anonymous" referrerpolicy="no-referrer"></script>
    <style>
        .container{ /*차트 상위 블록을 만들어 블록을 이용하여 크기를 지정한다.*/
            width: 400px;
            height: 400px;
            border:1px solid #ebebeb;
            border-radius:10px;
            padding:20px;
        }
    </style>
</head>
<body>
    <div class="container">
        <canvas id="line-chart"></canvas>
    </div>
</body>
</html>
<script>
    var target = $('#line-chart');

    const labels = [ // key값 지정
    '3월',
    '5월',
    '6월',
    '9월',
    '10월',
    '수능',
    ];

    const data = {
    labels: labels,
    datasets: [
        {
            label: 'STUDENT',
            pointRadius:5,
            pointHoverRadius:10,
            backgroundColor: 'rgba(255, 99, 132,0.5)',
            hoverBackgroundColor:'rgba(255, 99, 132,1)',
            borderColor: 'rgb(255, 99, 132)',
            borderDash:[20,5],
            data: [289, 278, 256, 278, 329, 293, 311], // 데이터(value) 넣어주는 장소
        }
    ]
    };

    const config = {
    type: 'line', // 타입은 차트의 모양을 선형(line) 차트로 할 것인지, 막대(bar)차트로 할 것인지 설정 가능하다.
    data: data,
    options: {
        maintainAspectRatio:false
    }
    };

    var myChart = new Chart(
        target,
        config
    );
</script>
이렇게 선형 차트가 만들어졌다. 이제 선형 차트에 배경을 넣어보자.
const data = {
  labels: labels,
  datasets: [
    {
    label: 'STUDENT',
    pointRadius:5,
    pointHoverRadius:10,
    backgroundColor: 'rgba(255, 99, 132,0.5)',
    hoverBackgroundColor:'rgba(255, 99, 132,1)',
    borderColor: 'rgb(255, 99, 132)',
    borderDash:[20,5],
    fill:true, // 배경 넣기
    data: [289, 278, 256, 278, 329, 293, 311],
  }
  ]
};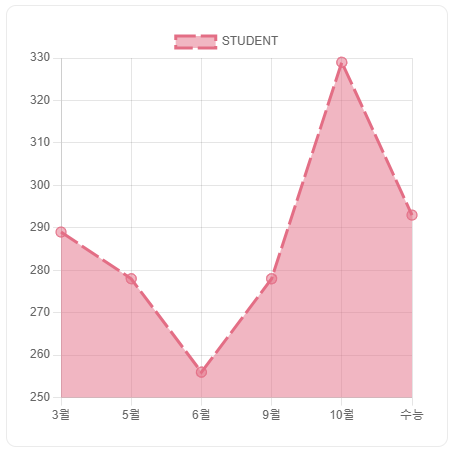
막대 타입의 차트도 만들어 보자. 막대차트는 type에서 bar로 변경만 해주면된다.
const config = {
  type: 'bar', // 변경 부분
  data: data,
  options: {
    maintainAspectRatio:false
  }
};
만약 두개의 차트를 동시에 나타내고 싶다면
const data = {
  labels: labels,
  datasets: [
    {
    label: 'STUDENT1',
    pointRadius:5,
    pointHoverRadius:10,
    backgroundColor: 'rgba(255, 99, 132,0.5)',
    hoverBackgroundColor:'rgba(255, 99, 132,1)',
    borderColor: 'rgb(255, 99, 132)',
    borderDash:[20,5],
    fill:true,
    data: [289, 278, 256, 278, 329, 293, 311],
  }
  ,{
    label: 'STUDENT2',
    pointRadius:5,
    pointHoverRadius:10,
    backgroundColor: 'rgba(0, 0, 255,0.5)',
    hoverBackgroundColor:'rgba(0, 0, 255,0.5)',
    borderColor: 'rgba(0, 0, 255,0.5)',
    borderDash:[20,5],
    data: [222, 333, 300, 280, 360, 211, 290],
  }
  ]
};
이런식으로 데이터를 연달아서 넣어주면된다.
 728x90
'IT 잡다한 거' 카테고리의 다른 글
The Movie DataBase API 발급 방법 (0) 2022.12.14 [MarkDown] Liquid Exception : Liquid syntax error (0) 2022.08.17